点群データの平面推定_part1
やること
- 平面の導出
- RANSACの勉強
平面の導出
平面の方程式
既知の点
を通る平面の方程式を求める
平面上の任意の点
とすると、平面上のベクトル
と平面の法線ベクトル
は直交するため、次式を得る
したがって、平面の方程式は、
となる。ここで、
とすると、平面の方程式は
で表される。
下準備(平面上のPoint Cloud生成)
まずは、理想的な平面のPoint Cloudデータを作成する
先ほどの面の方程式より面のPoint Cloudデータを作る
import numpy as np
import matplotlib.pyplot as plt
from mpl_toolkits.mplot3d import Axes3D
%matplotlib inline
# 法線ベクトル及びオフセット値
A = 0.0; B = 0.0; C = 1.0; D = -1.0
# point cloud 作成
points = []
for x in np.arange(0, 10, 0.1):
  for y in np.arange(0, 10, 0.1):
    for z in np.arange(0, 10, 0.1):
      if(A*x + B*y + C*z + D ==0):
        points.append([x, y, z])
points = np.asarray(points).T
points = np.asarray(points).T
# グラフ表示
fig = plt.figure()
ax = fig.add_subplot(111, projection = '3d')
ax.set_xlabel("X")
ax.set_ylabel("Y")
ax.set_zlabel("Z")
ax.plot(points[0],points[1],points[2])
plt.show()

平面推定
最小二乗法を使って平面を求めます
平面の方程式を以下のように変形します
先ほど作った点群が、すべて平面上にあると考えると、平面の方程式より以下の式が成り立つ

ここで、方程式を変形する
上記の式はの形で考えられる。ただし、
は非正方行列である。したがって、

とすることで、が求まる。
ただし、
が逆行列を持つ(正則)ことが条件である。
points = points.T
vecB = -points[:,2]
points[:,2] = 1

dim = np.dot(points.T, points)
vec = np.dot(points.T, vecB)
ans = np.dot(np.linalg.inv(dim), vec)

d = -(ans[0]*points[0,0] + ans[1]*points[0,1] + ans[2]*points[0,2])

print(dim)
print(vec)
print("A, B, C =", ans)
output
[[328350. 245025.  49500.]
 [245025. 328350.  49500.]
 [ 49500.  49500.  10000.]]
[49500. 49500. 10000.]
A, B, C = [4.4408921e-16 0.0000000e+00 1.0000000e+00]
points = points.T
A = ans[0]; B = ans[1]; C = ans[2]
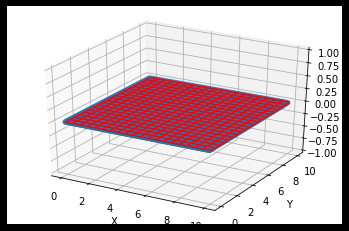
xmesh, ymesh = np.meshgrid(np.linspace(0, 10, 20),
                            np.linspace(0, 10, 20))
zmesh = (C + A * xmesh.ravel() +
        B * ymesh.ravel()).reshape(xmesh.shape)

fig = plt.figure()
ax = fig.add_subplot(111, projection = '3d')
ax.set_xlabel("X")
ax.set_ylabel("Y")
ax.set_zlabel("Z")

ax.scatter(points[0],points[1],points[2])
ax.plot_wireframe(xmesh, ymesh, zmesh, color='r')

plt.show()
